

Soil organic carbon (SOC) protection and sequestration in agriculture could contribute to the greenhouse gas (GHG) mitigation needed to achieve the 2050 global policy targets. According to some estimates, 18 to 38 billion tons of carbon could be stored in croplands globally over the next 20 years by implementing best practices for soil organic carbon sequestration.
However, it is difficult to be confident about these numbers until we have more evidence of what is possible. This research highlight summarizes several key publications that scientists affiliated with the CGIAR Research Program on Climate Change, Agriculture and Food Security (CCAFS) and partners have recently co-authored. The findings put forward by these publications could help decision-makers better manage policy ambition, emission trade-offs, measurement, reporting and verification (MRV) options, and achieve large scale impacts for soil carbon sequestration.
urrent Nationally Determined Contributions (NDCs) indicate that more than 40 countries have committed to practices relevant to SOC protection or sequestration, but have not specified SOC targets. Only ten countries currently refer explicitly to SOC in their agricultural NDC targets. This info note suggests that without explicit commitments to SOC targets, estimates of NDC contributions to mitigation will be difficult to assess.
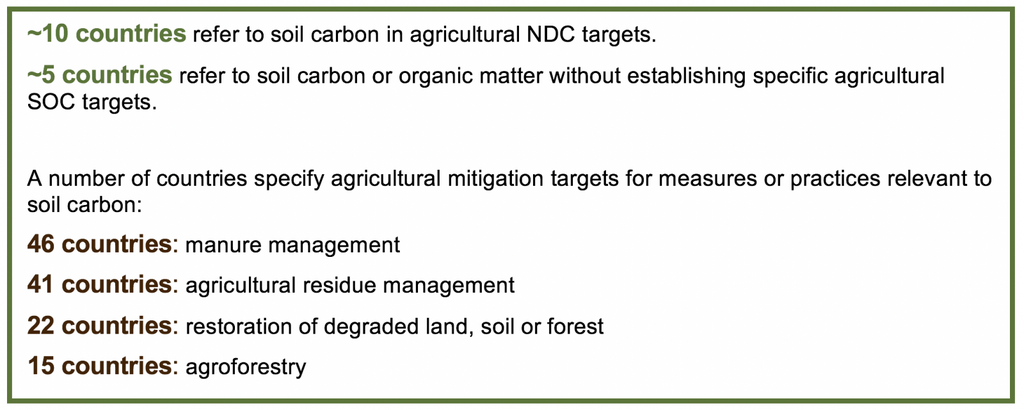
Soil carbon and related practices under agriculture in the NDCs. (Wiese et al. 2019)
In addition, the countries with the most potential to protect or store more SOC are n<>ot necessarily the ones that have made commitments. There is thus a gap between ambition and potential for SOC targets. If more countries are to set SOC targets, practical and cost-effective monitoring systems will be needed to better quantify and report on SOC.
A key recommendation of this info note is that quantifying SOC-related NDC targets should be discussed as an opportunity for countries to leverage support for relevant national policies and technical capacity development, leverage access to climate finance, and increase transparency for global SOC accounting.
Read the info note: Enhancing nationally determined contribution (NDC) ambition for soil organic carbon protection and sequestration
A major research and policy question is how different agricultural management practices affect soil carbon sequestration. One of our recent publications focuses on the impact of mineral fertilizer use on soil carbon sequestration, including synergies with the use of organic inputs (for example crop residues, animal manure) and trade-offs with GHG emissions.
Mineral or organic fertilizers can increase soil carbon stocks by:
Increasing crop yields, which can lead to an increase in the availability of organic residues that can be returned to the soil either directly, after composting, or after feeding to animals, as animal manure.
Improving the carbon-to-nitrogen ratio (C:N ratio) when crop residues are incorporated into the soil, thereby increasing the rate at which soil organic carbon forms.
The increase in soil organic carbon can also offset some of the emissions from mineral nitrogen fertiliser to help mitigate climate change; however, the net effect of nitrogen fertilizer use is typically an increase in net emissions.
Climate change mitigation policies focusing on fertilizer use and soil carbon sequestration should distinguish between regions with low yields and low fertiliser use, where net emissions are likely to increase if agricultural productivity is to increase, and regions with high mineral fertiliser use, where increasing the efficiency of fertilizer use is a priority. Generally, a combination of both mineral fertilizer and organic fertilizer is most promising for increasing crop yields, increasing nutrient use efficiency and soil carbon sequestration.
Since soil organic carbon content of soils cannot be easily measured, a key barrier to implementing programmes to increase soil organic carbon at large scale, is the need for credible, low-cost and reliable measurement/monitoring, reporting and verification (MRV) platforms, both for national reporting and for emissions trading. Without such platforms, investments could be considered risky.
This paper led by Pete Smith at the University of Aberdeen reviews methods and challenges of measuring SOC change directly in soils, as well as examines some recent novel developments that show promise for quantifying SOC. The authors lay out a new vision for a global framework for MRV of soil organic carbon change to support national and international initiatives.
CCAFS is soon launching its transformation action plan covering a variety of challenges to be addressed in our agricultural and food systems, including maintaining soil health in croplands for regenerative agriculture. We propose that to reach transformational scales, national government, the private sector and international development partners will need to commit to mainstreaming practices for improved soil health and soil organic carbon in croplands as a key element of sustainable farming and to fostering the necessary enabling environment and policy, including through giving these actions prominence in NDCs.
Negative emissions technologies offer an important tool to limit the global warming to <2 °C. Biochar is one of only a few such technologies, and the one at highest technology readiness level. Here we show that potassium as a low-concentration additive in biochar production can increase biochar’s carbon sequestration potential; by up to 45% in this study.
This translates to an increase in the estimated global biochar carbon sequestration potential to over 2.6 Gt CO2-C(eq) yr−1, thus boosting the efficiency of utilisation of limited biomass and land resources, and considerably improving the economics of biochar production and atmospheric carbon sequestration. In addition, potassium doping also increases plant nutrient content of resulting biochar, making it better suited for agricultural applications. Yet, more importantly, due to its much higher carbon sequestration potential, AM-enriched biochar facilitates viable biochar deployment for carbon sequestration purposes with reduced need to rely on biochar’s abilities to improve soil properties and crop yields, hence opening new potential areas and scenarios for biochar applications.
Technologies for CO2 removal from the atmosphere (so called Negative Emission Technologies) will be required to limit the global warming to <2 °C. Sequestering carbon in soil in the form of biochar has been discussed for around a decade and has shown great potential as a carbon negative strategy. Although uncertainties still exist regarding estimation of the residence time of biochar in soil based on its physical and chemical properties and soil conditions, it is generally accepted that carbon in biochar has a residence time in soil several orders of magnitude greater than the biomass it was produced from. Therefore, many studies use proxies for assessing the amount of stable carbon in biochar. Most relevant is the amount of carbon stable after 100 years in soil, the duration typically used to calculate the global warming potential of greenhouse gases. In various articles the carbon sequestration potential of biochar has been calculated to be in the range of 0.7–1.8 Gt CO2-C(eq) yr−.
Biochar is produced as one of the co-products of pyrolysis, which is the thermochemical conversion of biomass in the absence of free oxygen at temperatures above around 350 °C. This process yields three co-products in the form of pyrolysis solids (biochar), pyrolysis liquids (organic acids, phenolic compounds, etc.), and gases (CO, CO2, H2, CH4, C2H4, etc.). The yield of biochar, and also its carbon stability, are dependent on feedstock and pyrolysis conditions.
Increasing the percentage of stable carbon content in biochar is one way of increasing its carbon sequestration potential (the other is increasing biochar yield); this is typically achieved by increasing the severity of the pyrolysis process (higher temperature and longer residence time, which reduces solids yield, increasing C release as gas, leading to higher CO2 emissions when burned). In context of carbon capture and storage, however, the increase of the stable carbon yield, i.e. the amount of stable carbon that can be obtained from the same amount of biomass, is more relevant. Increasing the stable carbon yield relative to the parent biomass feedstock is in effect equivalent to reducing the amount of biomass needed to sequester a unit of carbon.
The stability of biochar carbon is related to its condensed aromatic nature, which in turn is affected by the composition of biomass feedstock and by processing conditions, mainly highest treatment temperature (HTT). Besides organic constituents (cellulose, hemicellulose and lignin), biomass also contains inorganic constituents, which content and composition is dependent on the type of biomass, growing location and to some extent the method of harvest and subsequent treatment. Previous studies showed that concentrations of certain constituents of the mineral matter, especially alkali metals (AM) and alkaline earth metals (AEM), such as K, Na, Ca, Mg, strongly affect biochar yields, with biochar yields increasing with elevated levels of AMs and AEMs due to catalysis of biochar formation. Yet, little is know about the effects of AMs and AEMs on the yield of stable carbon in biochar. In some studies the carbon retention in biochar was increased using additives, though very high additive to biomass ratios (w/w) were used, e.g. in Ren et al. Ca(OH)2 in a ratio of 1:9 was applied, in Zhao et al H3PO4 was applied in ratios of 0.359:1 and 0.718:1. In this study, we have used an order of magnitude lower loading of a low-cost additive (1 and 2%) which at the same time provides K to plants when resulting biochar is applied to soil.
The potential ability of AMs to catalyse biochar formation together with the fact that potassium is a valuable macronutrient makes the use of AMs as additives in biochar production a potentially attractive proposition. This is especially true, if the AM catalysed biochar has at least similar or better properties in terms of carbon stability as biochar produced without AM doping. Despite extensive research on biochar stability, no systematic investigation of stability of AM catalysed biochar has been reported to date. The research presented in this paper focused on increasing the carbon sequestration potential of biochar derived from the energy crop Miscanthus giganteus, by increasing biochar yield and stability using a common, low-cost additive, potassium acetate, and comparing the effects with those of sodium acetate doping.
Our results show that, as expected based on previous research and published literature, the biochar yield of Miscanthus biomass was strongly affected by the presence of AMs. Doping with AMs (1 wt% K+, 2 wt% K+ and 1 wt% Na+) unequivocally resulted in higher biochar yields, by 10.5–21.1% relative to the untreated biomass control, in the whole temperature range tested (350–750 °C). The relative biochar yield change compared to un-amended biomass pyrolysis shows that in the tested temperature range the biochar yield increase was independent of the HTT.
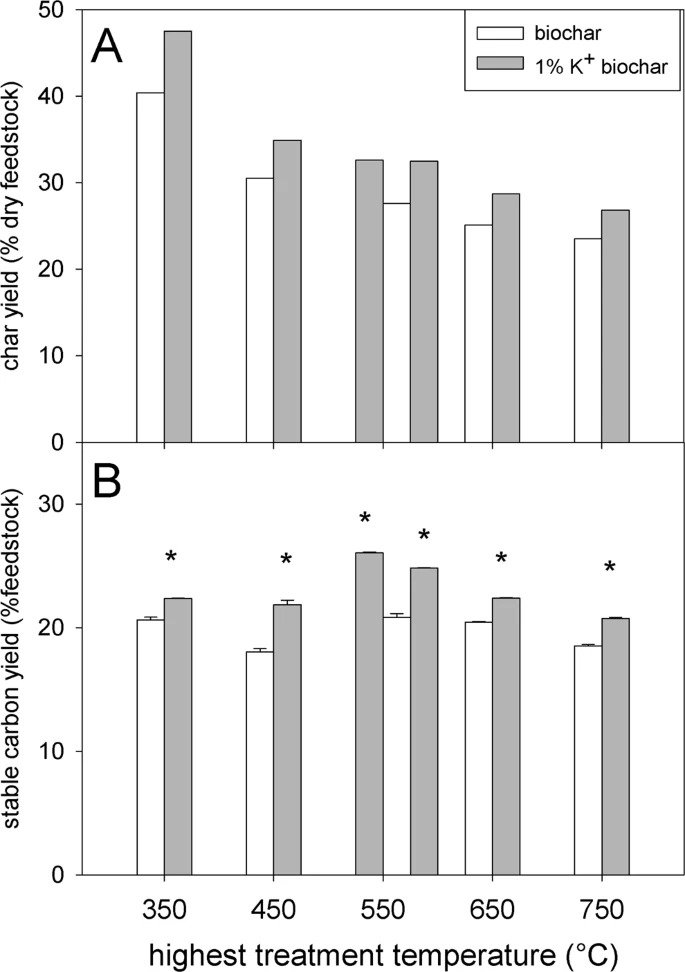
Miscanthus biochar yield (A; n = 1) and stable carbon yield (B; n = 3) of eleven biochar types. Eleven biochar types were produced at five different temperatures with and without 1% K+ doping (replicate at 550 °C). Stable carbon yield data is depicted on dry feedstock basis, taking the biochar yield into account (calculations see materials and methods). Error bars in Figure B show one standard deviation. The asterisks indicate statistically significant differences of the 1% K+ doping compared to the control, using two-sample, two-sided, equal variances t-tests. No statistical analysis was performed on biochar yield (no replications of pyrolysis itself).
Besides biochar yield, the content of stable carbon and subsequently the yield of stable carbon are the other two important parameters in terms of biochar’s ability to sequester carbon efficiently. In this study the stable carbon content was determined using a hydrogen peroxide oxidation method calibrated so that it corresponds to approx. 100 years of ageing in soil. The yield of stable carbon was determined as a product of biochar yield and stable carbon content. Both Na+ and K+ doping showed similar performance in increasing both biochar and stable carbon yields. The increase in biochar yield is a result of catalysis of the charring process by AM catalysts in the pyrolysis of lignocellulosic materials. In the presence of these metals the reaction process favours charring and dehydrating reactions, versus fragmentation and depolymerization pathways, in the primary decomposition of the holocellulosic fraction. In addition, AMs also enhance dehydration, demethoxylation, decarboxylation, and biochar formation in lignin pyrolysis.
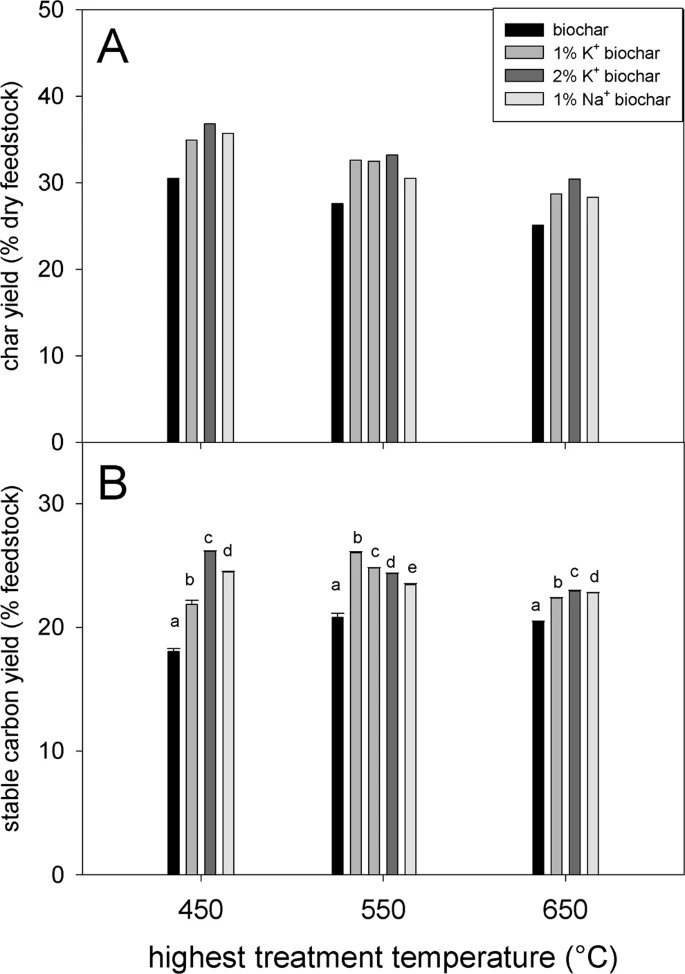
Miscanthus biochar yield (A; n = 1), and stable carbon yield (B; n = 3) of 13 biochar, produced at three different temperatures with four different AM dopings (1% K+ doped biochar produced in duplicates at 550 °C). Error bars in Figure B show one standard deviation. The letters indicate statistically significant differences between the treatments, using one-way ANOVAs followed by Tukey post-hoc test on biochar produced at the same temperatures. No statistical analysis was performed on biochar yield (no replications of pyrolysis itself).
All AM treatments considerably increased the stable carbon yield compared to the untreated controls. The relative change was between + 9.5% (1% K+ 650 °C) and +45.0% (2% K + 450 °C) (SI Table 4) and the average change was +20.4% for all AM treatments and pyrolysis temperatures.
This finding was confirmed with a different biomass feedstock material. Willow chips treated in the same way with 1% w/w K+ were also pyrolysed at 350, 550 and 750 °C (described in SI). The stable carbon yield was highest at a HTT of 550 °C with a 31.8% higher yield relative to the feedstock biomass than the corresponding untreated willow sample (SI Table 3). This shows that the effect of AM doping on stable carbon yield is not specific to one type of biomass (Miscanthus). 450 °C pyrolysis maximises the carbon sequestration potential of miscanthus biochar
Tailoring the pyrolysis conditions and hence the biochar properties to suit the biochar end use is a profound and essential feature of biochar production, and therefore any effects of AM additives on available range of processing parameters are of high importance.
In general, both AMs performed comparably in terms of stable carbon yield when added at the same concentration (1wt %) (Fig. 2B). Increased AM loading reduced the HTT at which the highest stable carbon yield was obtained. While pyrolysis of Miscanthus loaded with 1% K+ yielded most stable carbon at 550 °C, in the case of Miscanthus loaded with 2% K+ this was observed at 450 °C (Fig. 2B). At higher temperatures these differences between AM loading levels became less pronounced (Fig 1B, 2B).
Taking all AM-treatments together the relative increase in stable carbon yield was highest at 450 °C (Fig. 3B) with +33.9% on average for both AM doping levels. This observation has very important practical implications, as it means that production units operating at the lower end of usual pyrolysis temperature ranges (450–500 °C) could be used. Such units would not require high-grade stainless steel as a material for construction, reducing costs compared to units specified for higher temperatures. With increasing pyrolysis temperature, the pH and surface area of biochar increase while at the same time the functionality (O/C, H/C ratios) decreases31,32,33. Therefore, producing biochar at moderate pyrolysis temperatures, i.e. 450–550 °C, is a good compromise, not only providing high yield of stable carbon, but also yielding biochar with beneficial properties for soil amelioration (high surface area, high CEC).
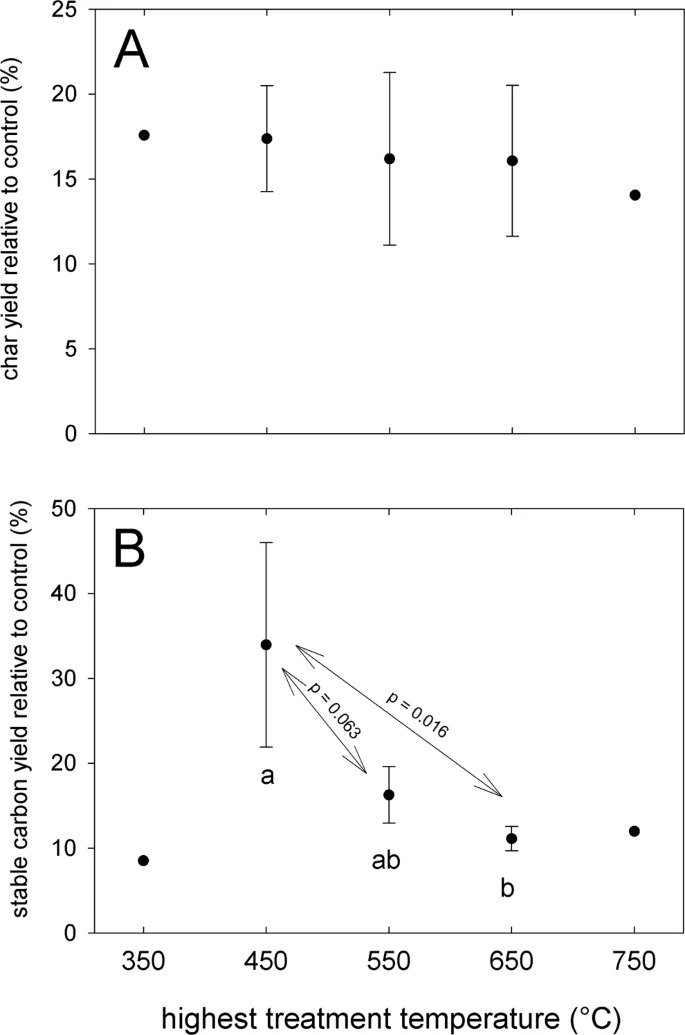
Biochar yield (A) and stable carbon content (B) of the biochar with AM doping relative to the control (biochar without doping). The error bars show one standard deviation. Letters show statistically significant differences between the treatments, with the respective p-values indicated above arrows. Number of n: 350 = 1 (only 1% K+), 450 = 3 (1% K+, 2% K+, and 1% Na+), 550 = 4 (1% K+ in duplicate, 2% K+, and 1% Na+), 650 = 3 (1% K+, 2% K+, and 1% Na+), 750 = 1 (1% K+).
The increased stability of carbon can be explained by the catalytic effect of AMs on biomass pyrolysis, such as enhanced cross-linking reactions (e.g., dehydration forming C=C or C-O-C) resulting in a highly cross-linked biochar, compared to biochar from untreated biomass34,35.
To further corroborate these findings, the structure of the biochar was investigated using Raman spectroscopy and X-ray diffraction (XRD), focusing on differences in the biochar carbon structure resulting from K+ doping. Raman spectra of the six biochar types investigated are shown in SI Fig. 2. Meaningful features of the spectra are (i) the position of the G peak, (ii) the relative intensity of the D and G peaks (the so-called ID/IG ratio), (iii) the shift of the D peak, and (iv) the width of the peaks. SI Fig. 2 shows that for both series the increase of temperature leads to a) a shift of the D-peak to lower wavenumbers, indicating a slight reduction in the size of defect free and/or edge free regions, b) a decrease in the width of the D peaks with increasing temperature, indicating a reduction in the structural disorder. At any given process temperature, the use of K+ (1 and 2 wt%) leads to lower G peak intensities, i.e. to higher ID/IG ratio. This indicates that the amount of disordered material as determined by Raman spectroscopy is larger for K+ treated Miscanthus biochar.
The XRD analysis of Miscanthus and K+ Miscanthus biochar confirmed the differences in biochar structure resulting from doping with potassium (see SI Table 5). The content of graphitic carbon, although small, increases because of K+ doping at all temperatures, with the effect being strongest at the lower end of the temperature range investigated. This is comparable with the trend seen for yield of stable carbon.
Based on this evidence we can conclude that although the carbon structure in the K+ Miscanthus biochar appears to be less ordered and more defective than that of untreated Miscanthus biochar, it has a comparable recalcitrance. It is important to note here that in comparing the information obtained from Raman spectroscopy and XRD care has to be taken since XRD is a bulk technique while Raman is sampling a few hundred nanometres close to the surface. Hence findings from these two techniques must be looked at as complementary. The overall effect of AM on biochar and stable carbon yield is schematically shown in SI Fig. 6. This finding is fundamental for developing biochar for carbon sequestration purposes as it means that use of AM doping can make pyrolysis much more efficient in converting biomass carbon to stable biochar carbon.
The potential of biochar to store atmospheric carbon has been estimated to be between 0.7–1.8 Gt CO2-C(eq) yr−13,12,13. Assuming a stable carbon increase of 45% as observed in this study for 2% potassium addition increases the carbon sequestration potential of biochar to between 1 and 2.6 Gt CO2-C(eq) yr−1, which corresponds to over 7% of current annual GHG emissions36 and close to 25% of annual atmospheric CO2 removal necessary to maintain atmospheric concentrations of CO2 at safe levels37.
Another conclusion that can be drawn from this finding is that to sequester a given amount of carbon in form of biochar, 31% less biomass, and therefore land would be required, compared to biochar without AM additives. This would further reduce biochar’s already relatively low land requirement, compared to other NETs options13.
In addition, tests of the K+-enhanced biochar showed that the majority of the K+ contained in the biochar was available and could be utilised by plants upon application of the amended biochar to soil (based on 0.01 M CaCl2-extraction (SI Table 6)). Therefore, K+-enhanced biochar provides not only a better tool for carbon sequestration, but also a better slow-release K-fertiliser, compared to unamended biochar.
To date, viable biochar applications have been inextricably linked to biochar’s ability to increase crop yields5,38. Due to its much higher carbon sequestration potential, AM-enriched biochar offers a price competitive option for atmospheric carbon removal compared to bioenergy and carbon capture and storage (BECCS), and direct air capture (DAC) etc., especially if low-cost sources of potassium, such as ash39, can be utilised. Under such scenario, crop growth improvements would still be a desirable option40, in fact a more likely one due to the increased K content, but no longer as critical for viable biochar implementation. This opens-up a whole new range of potential applications where carbon sequestration can be achieved, but where only small or no crop yield benefits could be expected, e.g., fertile soils, contaminated land, as well as non-soil applications (e.g., building materials, underground storage). This is a breakthrough approach to biochar deployment and a paradigm shifting finding.
To prepare AM-loaded Miscanthus with 1% and 2% w/w K+ content (0.256 and 0.513 mmol g−1 dry feedstock), potassium was added in a similar manner to previous work23,41,42 by spraying an aqueous solution (174.7 g L−1 and 349.5 g L−1) of potassium acetate (Sigma-Aldrich, ≥99.0%) onto oven-dried Miscanthus chips (approximately 10 mm in size) spread in a thin layer. In this way the desired level of potassium was introduced, and the biomass moisture was restored to the original level of ~12 wt%. Similarly, Na+ in form of an aqueous solution of sodium acetate (anhydrous, 98% pure, Fisher Scientific) (146 g L−1 sodium acetate) was applied to Miscanthus chips to introduce the same concentration in moles per weight of Miscanthus as 1% (w/w) K+ (256.4 μmol g−1 dry feedstock). This ensures that the same molar amount of AM is present in the 1% AM treatments independently of their molar weight which is equivalent to 0.59% (w/w) Na+. These organic salts were selected as additives due to their easy applicability, relatively low costs (potassium acetate 650–850 USD t−143), bulk availability, widespread use (e.g., de-icing, drilling muds, fertilisers, etc.), and low environmental impact44,45.
The untreated Miscanthus samples were pyrolysed at 350, 450, 550, 650 and 750 °C with a continuous auger reactor described in Buss et al.21 with mean residence time of the biomass in the heated zone of around 21.5 minutes. The 1% K+ doped Miscanthus was pyrolysed in the same temperature range, but with duplicate at 550 °C. Miscanthus doped with the other two AM treatments (2% K and 1% Na) was pyrolysed at the HTTs of 450 °C, 550 °C and 650 °C.
Biochar carbon stability
In this work, the chemical stability of biochar against oxidation in the environment was tested using a hydrogen peroxide wet oxidation method9. This method has been calibrated on naturally aged charcoal samples and corresponds to 92 and 187 years at mean annual temperatures of 17 °C and 7 °C, respectively. Hence, the stable carbon content determined in this study reflects the amount of carbon that is sequestered in the soil and for which carbon credits could be given. The method has also been cross-referenced with other proxies for carbon stability8, such as fixed carbon determined by proximate analysis (comparison of the two methods on the biochar samples from this study is provided in the supplementary information). The method is described in Cross et al.9 and in brief here. Before analysis, all biochars were ground to fine powder using a pestle and mortar, and homogenised sub-samples were used for the test. A char sample containing 0.1 g of C was mixed in a test tube with 0.01 mol of H2O2 in 7 mL of DI water. The test tubes were subsequently heated to 80 °C and kept at this temperature, with occasional agitation, for two days until the solution had evaporated. Subsequently, the remaining material was dried overnight at 105 °C before weighing the amount of residual char, and C content analysis. The carbon amount prior and post ageing was then calculated using the char amount and carbon content. The ratio of retained C to initial C gives the % stable carbon content.
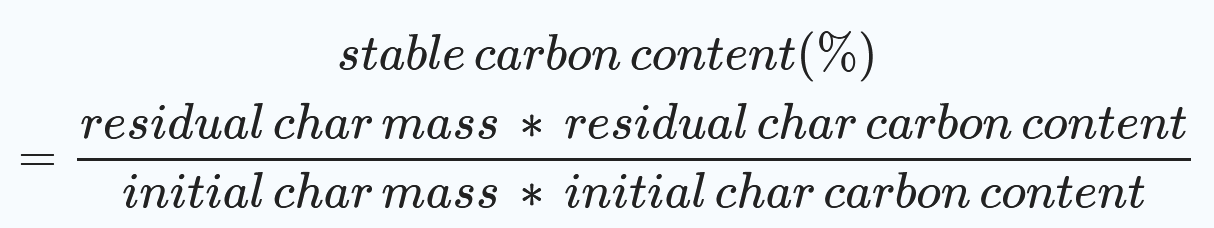
The analysis was performed in triplicate. By multiplying the stable carbon content by the char yield the stable carbon yield was calculated as described for the fixed carbon content by Antal and Grønli (2003)18. This corresponds to the efficiency of carbon conversion from biomass to biochar and serves as the key parameter for comparison in this work.
Raman spectroscopy
Raman spectra measurements were performed using a Renishaw InviaH instrument equipped with a green laser source (wavelength: 514.5 nm). All samples were taken as received (crushed) and placed on a microscope glass slide and flattened to obtain an optical field as flat as possible to improve the focus on the sample. Several points were examined for each sample. For each point we started with a low magnification objective (5x) zooming-in using a 20x and finally recording spectra with a 50x objective. The area of each spot examined had a width of about 2 μm2. Raman analysis being a volume technique, the signal is gathered from the sample surface up to a depth that varies with the optical properties of the analysed materials. In sp2-rich carbon materials this depth is of a few hundred nanometres (Ni, Z., Wang, Y., Yu, T. et al. Raman spectroscopy and imaging of graphene Nano Res. (2008) 1: 273. doi.org/10.1007/s12274–008–8036–1). The laser power was set at 5 mW in order to obtain a good signal-to-noise ratio while avoiding damage of the sample due to excessive heating. Each measurement was carried out in extended mode (100 cm−1 to 3500 cm−1) with an exposure time of 10 s and with 3 accumulations.
X-ray diffraction (XRD)
A Bruker D8 advance XRD instrument with a Cu Anode was used at 40 mA and 40 kV with a NaI detector which analysed at 1.5 s/step from 2 to 65° in 0.025°/step increments. The raw data were evaluated with the software TOPAS 3.0 Rietveld analysis. The biochar samples were spiked with 20% calcite to quantitatively measure the composition of mineral in the samples relative to a known concentration of calcite.
Statistics
Two-sample, two-sided, equal variances t-tests in Microsoft Excel were performed to determine effects of the 1% K+ addition on stable carbon yields. One-way ANOVAs followed by Tukey post-hoc tests (in SigmaPlot 13.0) were used to investigate the effect of the various AM treatments on stable carbon yield and the effect of the HTT on char yield and stable carbon yield taking the AM treatments as replications. Significant differences are given with a significance level of p < 0.05.


